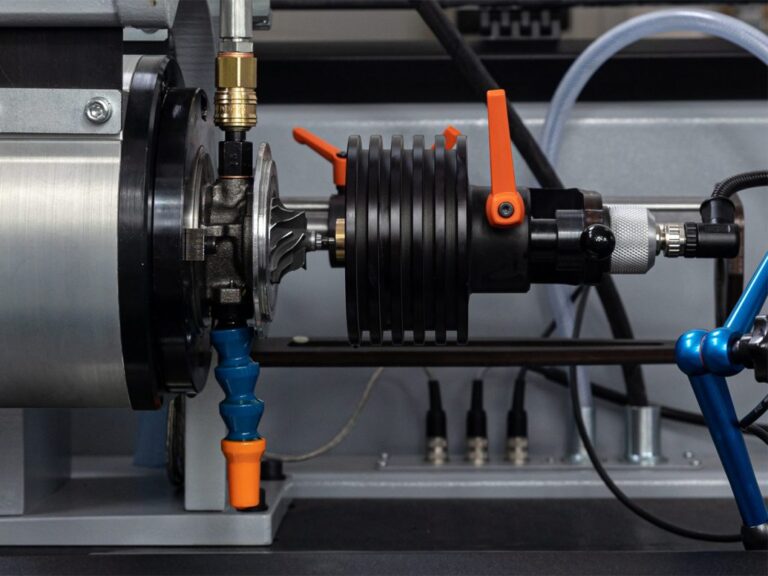
A single test cell can hold an entire production line hostage. When the equipment that verifies, calibrates or stresses your product stops working, finished units pile up with nowhere to go, upstream stations starve and the schedule you promised to customers quietly slips. The machines that perform this work, from automated test handlers and functional test cells to press-fit stations and conveyance motors, wear out in ways that are rarely sudden and almost always preceded by measurable warning signs.
As manufacturers fold AI and condition monitoring into their plants, predictive maintenance has shifted from a buzzword to a line-uptime strategy. Condition monitoring and predictive maintenance turn those warning signs into lead time. By watching how equipment behaves over its normal cycles and comparing that behavior against a known healthy baseline, you can catch a developing fault while it is still a small problem and schedule the repair on your terms instead of the machine’s.
This article covers:
- The signals that matter
- How baselining and anomaly detection work
- What remaining useful life estimation adds
- Why an alarm is not the same as a prognosis
- How all of it connects to your MES and broader production systems
Why Downtime on a Test Cell Stalls the Whole Line
A line moves at the speed of its slowest mandatory step. Test and assembly equipment is almost always on the critical path, because every unit has to pass through it, so when one of these stations goes down the effect is not local. It propagates in both directions and converts a single equipment failure into idle operators, blocked work in process and missed shipments.
Test cells are bottlenecks by design. They exist to gate quality, which means a product cannot advance until the cell signs off. A handler jam, a worn contact or a thermal chamber that drifts out of spec does not just slow throughput, it halts the gate entirely and leaves everything behind it stranded.
Unplanned stops cost far more than planned ones. An emergency repair pulls technicians off other work, often forces a wait on parts that are not in stock and tends to happen at the worst possible time. Planned maintenance during a scheduled window costs a fraction of the same repair performed under pressure with the line down and orders waiting.
The Signals That Reveal Equipment Health
Most mechanical and electromechanical failures announce themselves through physical signatures long before they cause a hard stop. Three families of signals carry the bulk of useful information, and together they cover the large majority of failure modes on production test and assembly equipment.
- Vibration signatures: Bearings, gears, belts and spindles each produce characteristic vibration patterns. As they degrade, energy shifts into specific frequency bands, so a rising peak at a bearing defect frequency is an early and specific indicator of wear well ahead of audible noise.
- Temperature signatures: Heat is a reliable proxy for friction, electrical loss and cooling problems. A motor, drive or gearbox that trends warmer cycle over cycle under the same load tells you that something has changed inside it.
- Motor current signatures: The current a motor draws encodes mechanical load. Analyzing that current reveals broken rotor bars, misalignment and growing mechanical resistance without adding sensors to the machine, because the motor itself acts as the transducer.
No single signal tells the whole story. Combining vibration, temperature and current, and correlating them with cycle counts and production context, produces a far clearer picture of true equipment health than any one channel on its own.
Beyond the Classic Triad: Test Signals and Self-Diagnosing Sensors
The three signal families above are powerful, but they represent only part of the available picture. On modern test and assembly equipment, a rich additional layer of diagnostic intelligence already exists inside the machine itself: in the sensors that perform the test.
Pressure transducers, temperature probes, position sensors, ultrasonic systems, vision systems and thermal cameras are all deployed primarily to characterize the product under test. But each of them is also a window into the machine’s own condition. A pressure sensor that drifts slightly from its calibrated baseline tells you something about the fixture, seals or supply circuit, not just about the part being tested. A vision system that records increasing edge blur or contrast degradation over time may be signaling lens contamination or actuator backlash before a single unit fails the visual check.
This matters because test-result data itself is one of the earliest and most informative condition indicators available. A gradual drift in the outcome of a specific test, like a measurement trending toward its limit without crossing it, is rarely random noise. It can reflect a genuine shift in the product population, but it can equally reflect a change in the machine or test conditions themselves. Recognizing the difference requires correlating test outcomes with environmental context (ambient temperature at a given time of day, shift pattern, operator identity, etc.) and with the internal state of the sensors performing the measurement.
When these signals are collected continuously and fed into an analytics platform, the machine’s own test infrastructure becomes a self-diagnosing subsystem. Anomalies that would previously surface only as unexplained yield loss or a sudden calibration failure instead appear as actionable leading indicators, weeks or days before the problem reaches the product.
Baselining and Anomaly Detection
Raw sensor data means little without a reference. The first job of any condition monitoring program is to establish what normal looks like for each asset under each operating mode, and that healthy fingerprint becomes the yardstick everything else is measured against.
Baselining captures healthy behavior. Over a representative period, the system records the normal ranges and patterns for each signal across different loads, speeds and product types. This baseline accounts for the fact that a station behaves differently when it is testing one variant versus another.
Anomaly detection flags meaningful deviation. Once a baseline exists, the platform watches for departures that are statistically significant rather than just momentary noise. The goal is to separate genuine drift, the slow march toward failure, from the ordinary variation that happens on every line, every day.
Context reduces false alarms. A reading that looks alarming in isolation may be perfectly normal for a particular product or ambient condition. Tying anomaly detection to production context keeps the focus on real problems and protects the credibility of every alert that does fire.
A System That Learns and Recommends
Static thresholds and fixed baselines are a starting point, not a destination. The most capable predictive maintenance platforms evolve continuously as they accumulate operational history. Each cycle adds to the model’s understanding of what a particular machine looks like in a given configuration, season and production context.
With agentic AI applied to this continuous data stream, the system moves beyond detection into recommendation. Rather than surfacing an anomaly and leaving the interpretation to the engineer, an agentic layer can classify the likely failure mode, cross-reference it against the asset’s full history and the fleet’s collective experience, and propose a specific corrective action: which component, procedure and time window. Over successive maintenance cycles, the accuracy of remaining useful life estimates improves, false-positive rates fall and the system’s recommendations become progressively more precise.
This continuous learning capability transforms predictive maintenance from a monitoring discipline into an operational knowledge asset. The longer the system runs, the better it knows each machine, and the more confidently it can commit to a maintenance schedule that protects both the asset and the production plan.
From Alarms to Prognostics and Remaining Useful Life
Here, the discipline of predictive maintenance separates itself from traditional monitoring. An alarm tells you that something has already crossed a line while a prognosis tells you how much time you have before it will.
Alarms are reactive thresholds. A temperature crosses a limit, a vibration level exceeds a set point and the system raises a flag. This is useful, but by the time a fixed threshold trips, the damage is often well underway and your options have narrowed.
Prognostics are forward looking. Instead of reporting a present state, prognostics model the trajectory of degradation and project where it leads. That shift from what is happening now to what will happen next is what makes proactive scheduling possible.
Remaining useful life (RUL) puts a number on it. RUL estimation translates degradation trends into an expected window before a component reaches the end of serviceable life. With an RUL estimate in hand, a planner can answer the question that actually matters, which is whether this machine will make it to the next scheduled window or needs attention sooner.
Acting on a prognosis follows a clear sequence:
- Detect the anomaly against the established baseline.
- Classify the likely failure mode from the signal signatures.
- Estimate remaining useful life and the confidence around it.
- Schedule the intervention inside a planned window and stage the parts.
- Verify the repair against the baseline before returning the asset to service.
Integration With MES and Production Systems
Condition data delivers its full value only when it lives alongside the rest of your production information. Equipment health that sits in a separate monitoring silo forces people to connect dots by hand, and that manual step is where insight gets lost.
MES integration adds production context. When health signals are tied to the work order, product variant, recipe and cycle running at the time, an anomaly stops being an abstract reading and becomes a specific story about a specific job on a specific machine.
Shared data drives better scheduling. Feeding RUL estimates into maintenance planning and production scheduling lets the two functions cooperate instead of compete, so repairs land in genuine gaps and the line keeps its commitments while the work still gets done.
Remote visibility shrinks response time. Surfacing equipment health on dashboards that engineers and managers can reach from anywhere means a developing problem gets eyes on it quickly, whether the right expert is on the floor or across the country.
Keep Your Line Running With Ascential Test & Measurement Systems
The Ascential Test & Measurement Systems analytics platform, Ascentialytics, is built to turn the signals coming off your test and assembly equipment into decisions you can act on. It delivers real time insights, anomaly detection against learned baselines and continuous equipment health tracking, so a developing fault on a critical test cell surfaces as a clear, prioritized alert instead of a surprise stoppage.
Paired with our field service, Ascential Care, that visibility becomes a partnership. The service team brings remote monitoring and expert support to your assets, watching health trends alongside your team, helping interpret anomalies and recommending interventions before remaining useful life runs out. The combination connects naturally to your MES and production systems so equipment health informs the same schedule everyone else is working from.
If unplanned downtime on a test cell has ever stalled your whole line, it is worth seeing what continuous condition monitoring can do for you. Reach out to learn how our team can help you catch problems early, plan repairs on your terms and keep production moving.
Frequently Asked Questions
What is the difference between condition monitoring and predictive maintenance?
Condition monitoring is the practice of measuring equipment signals such as vibration, temperature and motor current to track health over time. Predictive maintenance builds on that data, using baselining, anomaly detection and remaining useful life estimation to forecast failures and schedule repairs before a breakdown occurs.
How is remaining useful life actually estimated?
RUL estimation analyzes how a component’s signal signatures trend away from their healthy baseline. It also models how that degradation looks going forward to project when the part will reach the end of serviceable life. The result is an expected time window, along with a confidence level, that planners can use to decide whether an asset can safely wait for the next scheduled maintenance.
Why is an alarm not enough on its own?
An alarm reports that a value has crossed a fixed threshold, which usually means a fault is already developing and your time to react is short. Prognostics look ahead and estimate how much life remains, which turns maintenance from a scramble into a planned activity you can schedule on your own terms.
Do I need to add sensors to every machine?
Not always. Many signals are already available, since motor current analysis uses the motor itself as a sensor and many modern drives and controllers expose useful data. Where additional coverage is needed, targeted vibration and temperature sensing on the highest risk assets often delivers most of the benefit without instrumenting everything.
It is also worth remembering that the sensors built into the test equipment itself such as pressure transducers, position encoders, vision systems and thermal cameras, are a largely untapped source of machine health data. Enabling self-diagnostic analysis on these instruments can extend condition monitoring coverage significantly without any additional hardware.
How does predictive maintenance connect to my MES?
Equipment health data becomes far more actionable when it is correlated with the work order, product and cycle context that an MES holds. Integrating the two lets anomalies be tied to specific jobs and lets remaining useful life estimates flow into maintenance and production scheduling so repairs fit into planned windows.
Can the system improve its accuracy over time?
Yes. Platforms built on continuous learning refine their models with every cycle and every resolved maintenance event. Agentic AI layers can cross-reference failure signatures across the fleet, update degradation models automatically and improve the specificity of their corrective recommendations as operational history accumulates. The result is a system that becomes progressively more accurate in its RUL estimates and progressively more targeted in the actions it recommends.
Sources
- NIST, Measurement Science Roadmap for Prognostics and Health Management for Smart Manufacturing Systems
- DOE OSTI, Operations and Maintenance Best Practices, A Guide to Achieving Operational Efficiency (Release 3)
- NIST, Economic Analysis of Technology Infrastructure Needs for Advanced Manufacturing, Smart Manufacturing